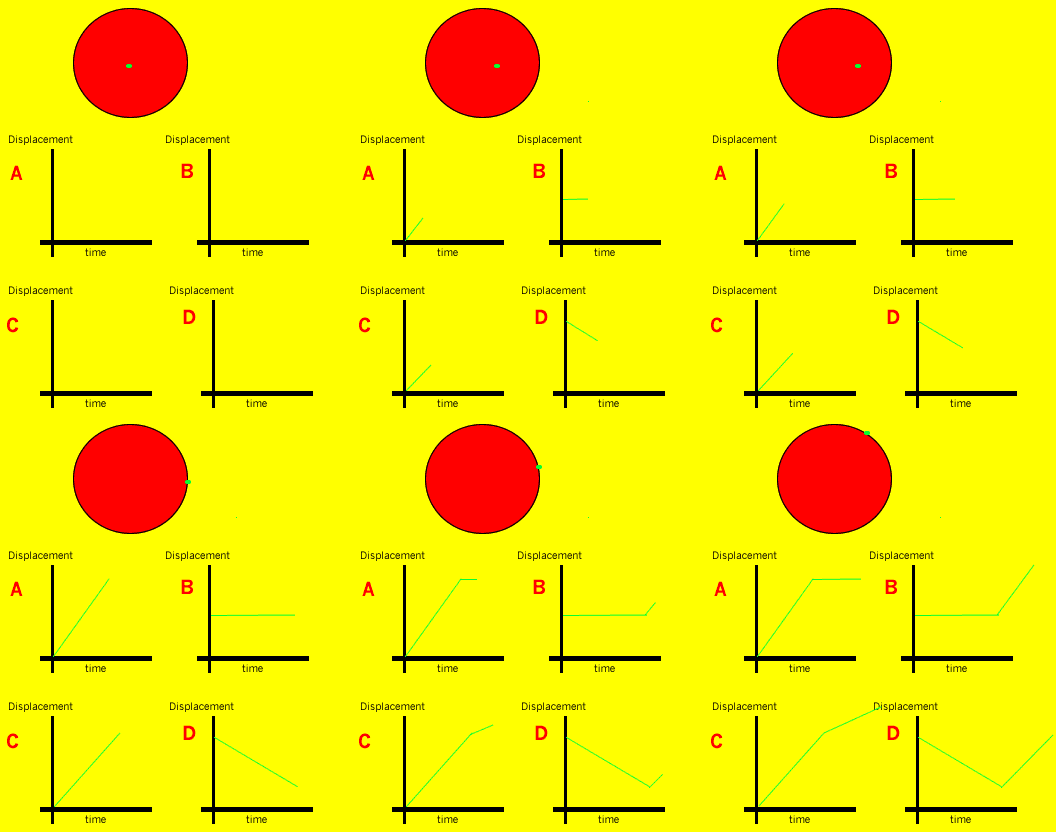
An ant crawls from the centre of a circle in a straight line to the egde. It then crawls along the perimeter of the circle as shown in the animation on the right.
Which one of the graphs shown best represents the displacement-time graph? | |
|
|
|
The Solution...
The displacement of the ant is the direct distance, in a straight line, from the start of its journey to its current position. As it travels along the radius the displacemnt is increasing, however, when crawling along the perimeter it will always be a length equivalent to the radius away from the centre.
Click on the solutions link for more information on displacement.
Click here for solution

(c) Dynamic Science.
