analyisng data and identifying trends.
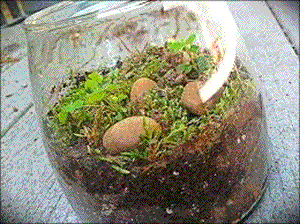
Green moss was placed in a sealed clear plastic container and left out on a window ledge exposed to daylight.
Analyse the data carefully.
| Closed ecosystems analyisng data and identifying trends. |
|
Green moss was placed in a sealed clear plastic container and left out on a window ledge exposed to daylight. |
|
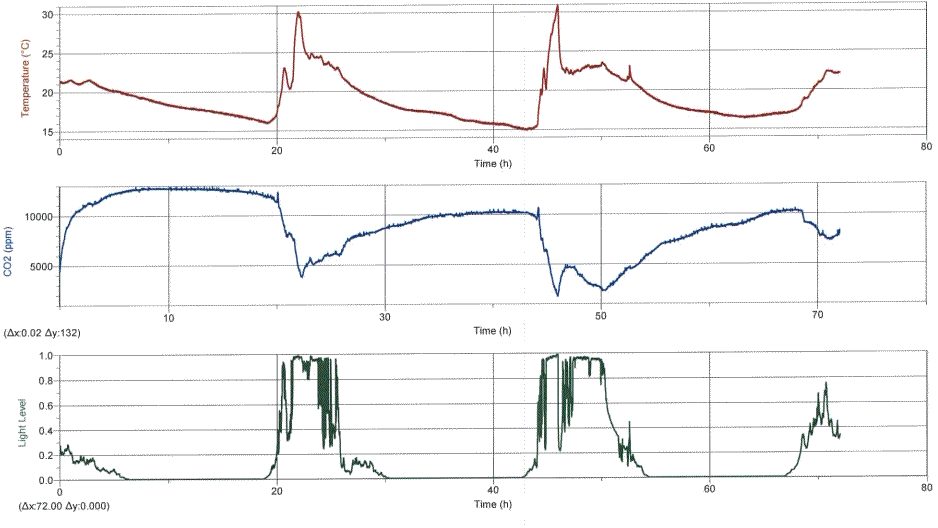
| Light, temperature and gaseous carbon dioxide found in the sealed bottle were measured at regular intervals over a 48 hour period. Below is the data represented in graphical form. Recording commenced at 2.00 pm on the first day. | |
|
|
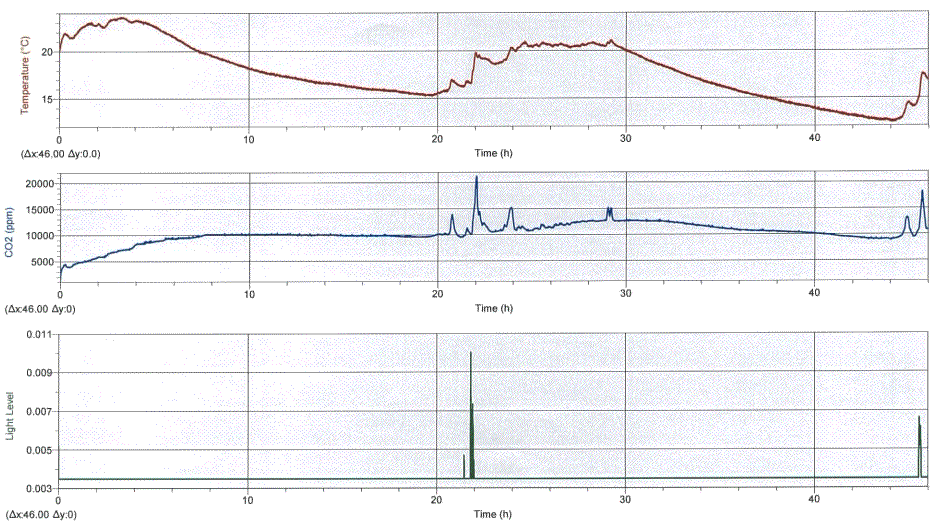
| Another experiment was conducted under exactly the same conditions except that the bottle was painted black to exclude all light from entering. Below is the data represented in graphical form. | |
|
|
Analyse the data carefully.
|
|
| What was the experimenter trying to achieve by having a second bottle, with light blocked out? | |
| What are the trends for each variable? | |
| How are variables, light, temperature and carbon dioxide related? | |
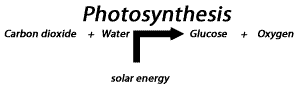
| Using your knowledge of photosynthesis and cellular respiration give a detailed explanation of these trends and relationships. | |
| What does the data suggest about the amount of carbon dioxide used by the plant as compared to the amount of carbon dioxide consumed by the plant? Explain. | |
| What do you expect would happen to the amount of gaseous carbon dioxide in the bottle if several snails were added? Explain. | |