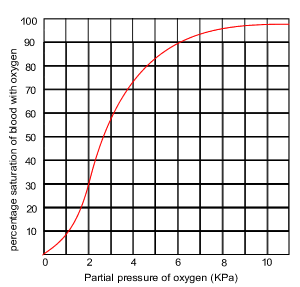
Consider the oxygen dissociation curve for human haemoglobin on the right
The "S" shape of the curve is indicative of haemoglobin's
According to the graph, what will happen if the oxygen level drops due to tissue utilisation?
According to the graph, what will happen if the oxygen level increases in the tissues as happens when blood enters the lungs?
The range of oxygen pressure in the tissues ranges from say 2 to 6 kPa. Which comment is true according to the graph on the right?
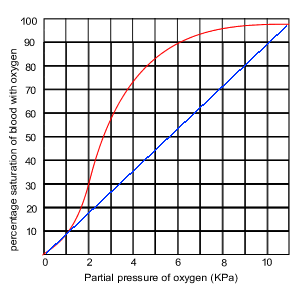
The graph on the right shows the "S" shaped oxygen dissociation curve for haemoglobin. What would the difference be if the relationship between percentage saturation and oxygen pressure was a linear one as shown by the blue line? To help you answer this question consider the:
- percentage saturation at 6 kPa of both graphs;
- the change in percentage saturation of both graphs as the pressure of oxygen changes from 4 to 2 kPa.
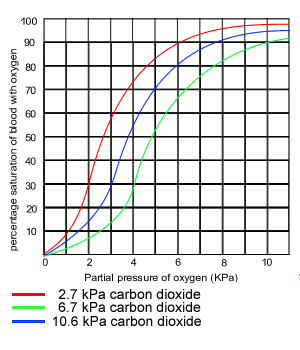
The oxygen dissociation graphs on the right are taken at three different concentrations of carbon dioxide. As you can see, as the concentration CO2 increases the graph shifts down and to the right.
A shift to the right means that
Consider the graph on the right. Which comment is true?
It is argued that the influence of carbon dioxide on haemoglobin is a beneficial one? Discuss .
Consider the level of carbon dioxide in the respiring tissue and the level of carbon dioxide in the lungs. You would assume that the carbon dioxide level in the lungs is lower due to its continual escape into the atmosphere.
Carbon dioxide makes haemoglobin less efficent at taking up oxygen but more efficient in releasing it. Therefore oxygen is released in tissues with a great deal of carbon dioxide due to respiration. Whilest at the lungs, where the pressure of carbon dioxide is low due to constant removal, uptake of oxygen is favoured.
Hide
Solution