Relative atomic masses of elements can be obtained using a mass spectrometer. Not only can a mass spectrometer be used to derive atomic masses but it is also used for:
- quantitative analysis, where the concentration of minute amounts of substance can be calculated, using a calibration curve for a unique signal at a known m/z value.
- qualitative analysis, where the mass spectrum of a compound produced by the mass spectrometer is unique and offers a fingerprint of the particular substance which can be identified from a database of mass spectra. The spectrum can also give information about the structure of an unknown compound.
See the video on the right for an overview.
This particular machine separates out the different isotopes or charged fragments according
to their mass and calculates their relative abundance. The information
is presented graphically as a mass spectrum. Its operation is as follows.
- Firstly the mass spectrometer vaporizes the compounds or elements that
must be investigated.
-
The vapour is then subjected to electron bombardment.
When high energy electrons collide with the molecule, bonding and non-bonding
electrons can be removed from the molecule creating positive charged ions.
-
After electron bombardment, fragmentation of the original molecule can
occur producing a variety of cations. These ions are accelerated through
a magnetic field before they are collected on a photographic plate. The
image given is of a set of peaks.
- Heavier particles, have a greater momentum and thus travel further
along the photographic plate than the lighter ions. How quickly the charged particles bend onto the photographic plate depends on the (m/e) mass to charge ratio of the particle.
- The strength of the magnetic field can be adjusted to allow particles of different m/e ratio to be displayed.
View the video above then answer the questions below.
1) The mass spectrum of an unknown compound is shown on the right. This gives us an indication as to the
2) What is the likely molecular mass of the compound?
3) The horizontal axis is labelled m/z. What does this represent?
4) In the mass spectrometer the compound under investigation is ionised and fragmented by
5) Click to see the mass spectrum of nitrogen dioxide.
i) How many
ionised fragments are possible?
ii) Which of the following represent the peak at m/z=30
a) NO2+ b) NO+ c) N+ d) O+ e) NO- f) N0-2
6) The method used to fragment the compound
7) Adjusting the magnetic field that the charged particles are exposed to enables
The animation on the right shows a simplified view of the mass spectrometer. Notice how heavier particles travel further before looping into the photographic plate as they have more momentum. If the particles fall out of the range of the photographic plate, the magnetic field can be adjusted so that light or heavy particles can be detected.
Scan the image for more information
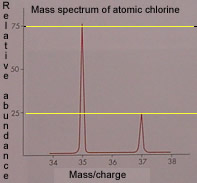
Isotopes of elements can be detected using a mass spectrometer. The mass spectrum is composed of a set of spikes whose position along the "X" axis determines the mass of the isotope. The height of the peak determines the relative abundance of the isotope. For example the picture on the left is the mass spectrum of atomic chlorine. We can deduce that chlorine has two isotopes (two peaks) of mass 35 and 37 atomic mass units. The relative abundance of isotope 35 is 75% while that of isotope 37 is 25%. The peak at mass /charge 35 is probably that of the ion 35Cl+1. While the peak at 37 is that of the 37Cl+1 ion.
The mass spectrometer can also be used for quantitative purposes. The concentration of a compound can be detected by setting the instrument to measure a certain m/z value which corresponds to the compound in question. A standard is also introduced, which is similar to the compound.
Take the mass spectrum on the right. An m/z value around 158 is chosen as this is the molecular mass of the compound in question. A standard is introduced, right most peak, which has the heavier isotope of nitrogen and hence appears at m/z 160. Knowing the concentration of the standard the peaks can be compared to derive the concentration of the substance under investigation.