A type of ceramic cooking pot contains dangerous levels of lead. Lead leaches out during cooking to contaminate the food. A student was given the task of calculating the level of lead in the food cooked in one such ceramic pot.
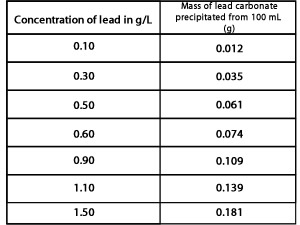
The student made up seven solutions of lead with known concentrations. He then took 100 mL of each solution and precipitated the lead as lead carbonate and weighed the sample. The results are shown on the right in table form.
Graph the results on an appropriate set of axis and draw a line of best fit . This is known as a calibration curve. A calibration curve is an analytical tool for determining the concentration of a substance in an unknown solution. By comparing the unknown solution to a set of standard samples whose concentration is known we can find the concentration of the substance of interest in the unknown solution.
The student then proceeded to take 100 mL of the soup that was cooked in the suspect pot. He added excess sodium carbonate solution to precipitate the lead as lead carbonate. Use your calibration curve to answer the questions below
1) What is the maximum yield of lead carbonate that can be obtained from a 100 mL solution with a lead concentration of 1.5 g/L? Solution
2) What is the maximum yield of lead carbonate that can be obtained from a 100 mL solution with a lead concentration of 0.55 g/L? Solution
3) What is the lead concentration of a 100 mL solution that yields 0.85 grams of lead carbonate? Solution
4) A student obtained 300 mL of an unknown solution containing lead. The maximum yield of lead carbonate was 0.24 grams. What was the concentration of lead in g/L?
5) What is a calibration curve? How is it used in analytical chemistry?
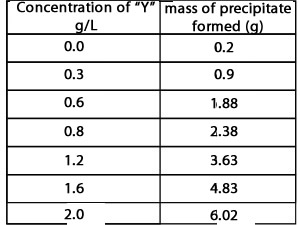
A student was asked to analyse an unknown solution for its "Y" concentration. The student prepared six solutions by adding a known mass of "Y" to one litre of pure water. All of the "Y" was then precipitated out, from a 20 mL sample of each solution, dried and weighed. The results are presented in the table on the right.
1) Construct a calibration curve using the results in the table above and an appropriate set of axis.
2) Does the calibration curve go through the point (0,0)? Explain why or why not.
3) A 20 mL sample of an unknown solution yielded 4.00 grams of precipitate. What was the concentration of "Y" in the unknown solution?
4) A solution was prepared by adding 0.500 grams of "Y" to one litre of water. A 60 mL sample of this solution was obtained and all of "Y" precipitated out. What was the mass of the precipitate?
5) A solution was made by dissolving 2.4 grams of "Y" in 2 litres of water. A 20 mL sample was taken. What is the maximum yield of precipitate obtained from the 20 mL sample?
Continue with an acitivity to determine lead levels in an unknown sample of contaminated water