Acceleration
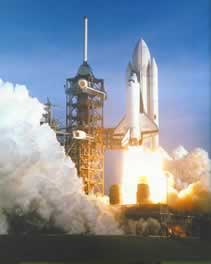
The Space Shuttle accelerates off the launch pad at 50m/s/s. Every second the Shuttle increases its speed by 50m/s. From a standing start it increases its speed from zero to 50m/s in the first second of flight. Two seconds into its flight and its speed is now 100m/s.
The rate at which the speed
of an object changes is called acceleration.
If we were to look at the speed-time graph of an object in motion the
slope of the graph would represent the acceleration.
Look at the speed-time graph on the left.
Notice that the object accelerates between 0 and 5 seconds. The acceleration can be calculated by calculating the slope of the graph.
Slope = acceleration = Rise/run = 10ms/5s = 2m/s/s. So the speed is increasing by 2m/s every second.
Between 5 and 10 seconds the speed is constant and therefore the acceleration is zero.
The object once again accelerates
between 10 and 13 seconds. the acceleration is calculated.
Slope = acceleration = Rise/run = 20ms/3s = 6.7m/s/s. So the speed is
increasing by 6.7m/s every second.
Between 13 and 16 seconds the
object is accelerating but at a lesser rate.
Slope = acceleration = Rise/run = 2ms/3s = 0.67m/s/s. So the speed is
increasing by 0.67m/s every second.
During the last 6 seconds a strong deceleration occurs.
Slope = deceleration = Rise/run = 22ms/6s = 3.7m/s/s. So the speed is
decreasing by 3.7m/s every second.