Distance to Speed graphs
We can obtain a speed vs time graph from a distance vs time graph. The gradient of the distance vs time graph represents the speed of the object in question.
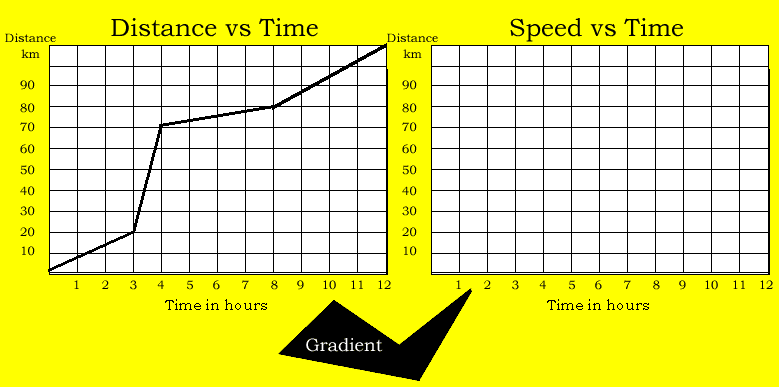
Not always will the distance-time graph be a straight line. Often, in real life situations, the disatnce-time graph is curved and the slope must be calculated frequently at small time time intervals. Click to see an example