A simple NMR spectrometer consists of :
-a radio transmitter that produces
the radio waves
-a radio receiver to detect the emitted radio waves
-a computerised recorder that analyses the data and depicts it in graphical
form.
-a sample that is placed in a glass tube and is constantly spun as it
is analysed
-a powerful magnet to produce strong magnetic fields.

A proton NMR spectrum shows us the number of unique chemical environments, within the molecule, that hydrogens are found in. Two types of NMR exist, low resolution and high resolution.
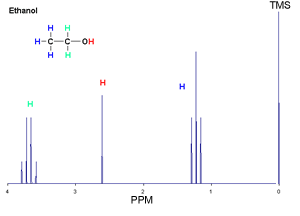
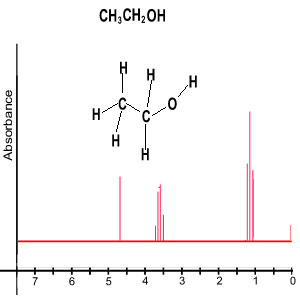
Let's discuss high resolution NMR first. As the name implies this spectrum shows more detail than the low resolution spectrum. Consider the high resolution spectrum of ethanol shown below.
What does an 1HNMR spectrum tells us.
1) The number of sets of peaks indicate the number of different hydrogen environments
2) The area under each set of peaks indicates the number of hydrogens in that particular environment.
3) The splitting pattern reveals the number of chemically different neighbouring hydrogen atoms. The signal from a group of chemically identical protons is split into a number of peaks equivalent to n + 1, where n is the number of chemically different neighbouring protons.
Take the ethanol spectrum shown on the right. What do we see?
-Firstly we notice a set of peaks. Discounting the big peak at a shift of 0 which is the TMS reference point, we see 3 sets of peaks that indicate 3 different chemical environments that protons exist in.
-The set of peaks with the blue colour represents the methyl group(CH3). The next group of peaks in green represent the methylene group (CH2) and the single peak in red represents the hydrogen of the hydroxyl group(OH).
Click for a more detailed look at what an NMR spectrum reveals.
Take the molecule ethan-1,2-diol, shown on the right..
What would we expect to see in its 1H NMR spectrum?
- it has two hydrogen environments so we should see two sets of peaks.
- we would expect one peak to be twice as high as the other, since there is twice as many hydrogens in one environment than the other.
- both peaks will be singlets. Since the hydrogens on the OH are equivalent and have no neighbours the n+1 rule dictates that there is only one peak. The two CH2 groups can not split each others signal as they are identical. So again only one peak for the four hydrogens on the CH2 groups.

Take the molecule chloroethane shown on the right..
What would we expect to see in its 1H NMR spectrum?
- it has two hydrogen environments so we should see two sets of peaks.
- we would expect one signal to have 2/3 the area of the other, since there is a CH2 and a CH3
-The larger signal, the CH3 , would be split into three peaks by the neighbouring CH2 thus folloowing the n+1 rule. The smaller signal woud be split into 4 peaks by the neighbouring CH3, again following the n+1 rule.

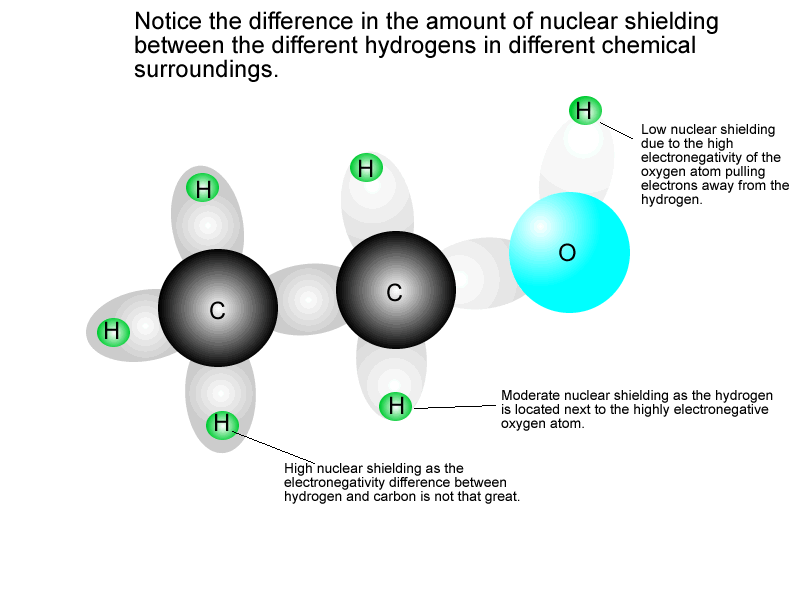
An important thing to note is the impact of the oxygen atom, which has a high electronegativity, on the chemical shift of the hydrogens. To demonstrate this point note the 1H NMR spectrum of C4H8O2 shown on the right. Click on the isomers below to show the 1H NMR spectrum of each isomer.
Three isomers exist:
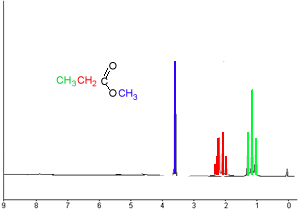
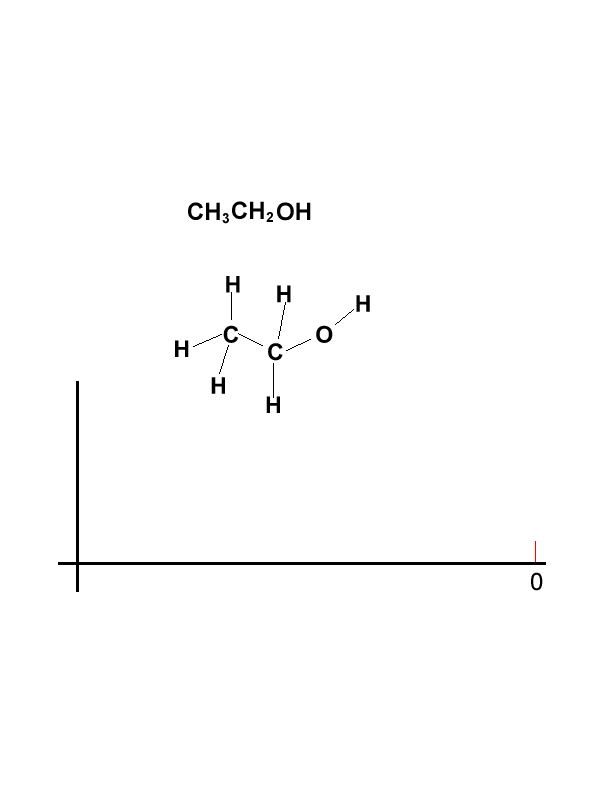
From the number of peaks in each set we can deduce information about the neighbouring groups of hydrogens. For example lets look at the set of three peaks in blue, in the diagram above. From the area under the peaks we can deduce that this is a CH3 group. But from the number of peaks we can deduce that it is next to a CH2 . The number of peaks in a set is equivalent to n + 1, where n is the number of hydrogens, normally attached to a neighbouring carbon in a different chemical environment. Unless the hydrogen is attached to an oxygen as is the case in ethanol, pictured on the right. Click to see how we derive the spectrum for ethanol
This is known as the n+1 rule. It is a simple way to view NMR spectra and deduce useful information for only a number of select molecules. NMR spectroscopy is very complex but we will simplify it in this unit of work.